Mastering Professional Services KPIs:

Five Essential Metrics for Consistent Project Success

INTRODUCTION

The Illusion of Success

The pursuit of growth at the expense of profit margins is a common occurrence in various industries, but it is particularly prevalent in professional services (PS) businesses. In helping hundreds of PS organizations attain higher performance, we at Kantata have encountered this particular struggle over and over again. And it is unnecessary.


So, why does it happen?


Professional services organizations that deliver fee-based work to clients are incredibly complex to manage, especially through growth.

There are many dynamics within these PS businesses that change daily.

This challenge is often exacerbated by the use of disconnected systems that keep key data points about their people, projects, and financial performance in silos. This fragmented information must then be brought together at regular intervals to provide insights into the levers and measures that impact the business.


Services businesses encounter three common challenges as a result

CHALLENGE 01

Difficulty forecasting revenue

In the past, clients would sign contracts for long-term, assured engagements, sometimes lasting years, making revenue forecasts somewhat easy. Today, projects are much shorter and more rapid. Clients evaluate budgets and project success metrics much more frequently, creating more uncertainty for providers. These realities have made it much more difficult for services providers to accurately forecast future revenue.
CHALLENGE 02

Uncertainty in resource planning against demand

Services businesses need to be extremely agile in allocating the right resources in the right places to maximize profitability. Too many people on the bench can drive down profit margins, and having too few people available limits what can be taken on. Keeping track of the utilization of dozens, hundreds, and sometimes thousands of resources in real-time is daunting.
CHALLENGE 03

Lack of real-time visibility into project profitability

There is very little room for error when making decisions in real-time during the professional services project lifecycle. Miscommunication and scope creep can reduce your profit margins before you realize what even happened. Waiting a month for a profitability report from your finance team can be devastating to your margins. Professional services organizations need real-time visibility into their performance. They also need to know which key performance indicators (KPIs) to focus on in order to truly understand project, portfolio, client, and business health.

What are KPIs?

Key Performance Indicators (KPIs) are crucial metrics that professional services organizations use to gauge their performance and success in various areas of operation. Essentially, KPIs are quantifiable measures that provide insights into how effectively a company is achieving key business objectives, enabling managers and project delivery leads to make informed decisions. These indicators, rooted in the SMART criteria—Specific, Measurable, Achievable, Relevant, and Time-bound—vary by company and industry but typically assess financial health, client satisfaction, operational efficiency, employee performance, and project success.

There are two main types of KPIs to be aware of: lagging and leading. Lagging KPIs offer a retrospective view, measuring outcomes after they have occurred, which is crucial for understanding the effectiveness of completed initiatives. On the other hand, leading KPIs are forward-looking metrics, designed to predict future performance and help managers make proactive adjustments.

Why do you need to track KPIs?

By effectively monitoring a balanced mix of these key performance indicators, professional services organizations can ensure they’re not only keeping pace with current demands but also strategically positioning themselves for future success. Understanding and utilizing KPIs effectively can significantly enhance decision-making, boost performance, and maintain a competitive edge in the market.

Because of this, services firms have a profound need for business intelligence (BI) tools that can help decision-makers make sense of vast swaths of information in order to make profitable decisions. Without this clarity, success is just an illusion. Yes, you’ve been busy. Yes, you’ve served clients. But you could be less busy and serve more clients — and be more profitable?

So how do you move from busy to breakthroughs?

The following eBook will discuss the five most critical KPIs that every services business needs to have readily available, and how to calculate them, so you can turn your data into decisions. This is a framework — your business will need to determine the appropriate starting point, target, and timeline for each of the five most critical KPIs outlined in this guide:
  1. Project Margin
  2. Planned and Actual Utilization Rates
  3. Billable Performance to Target
  4. Total Availability by Month
  5. Supply vs. Demand
IN THE NEXT SECTION
We will discuss one of the most critical KPIs for any business with billable workers — project margin at completion.
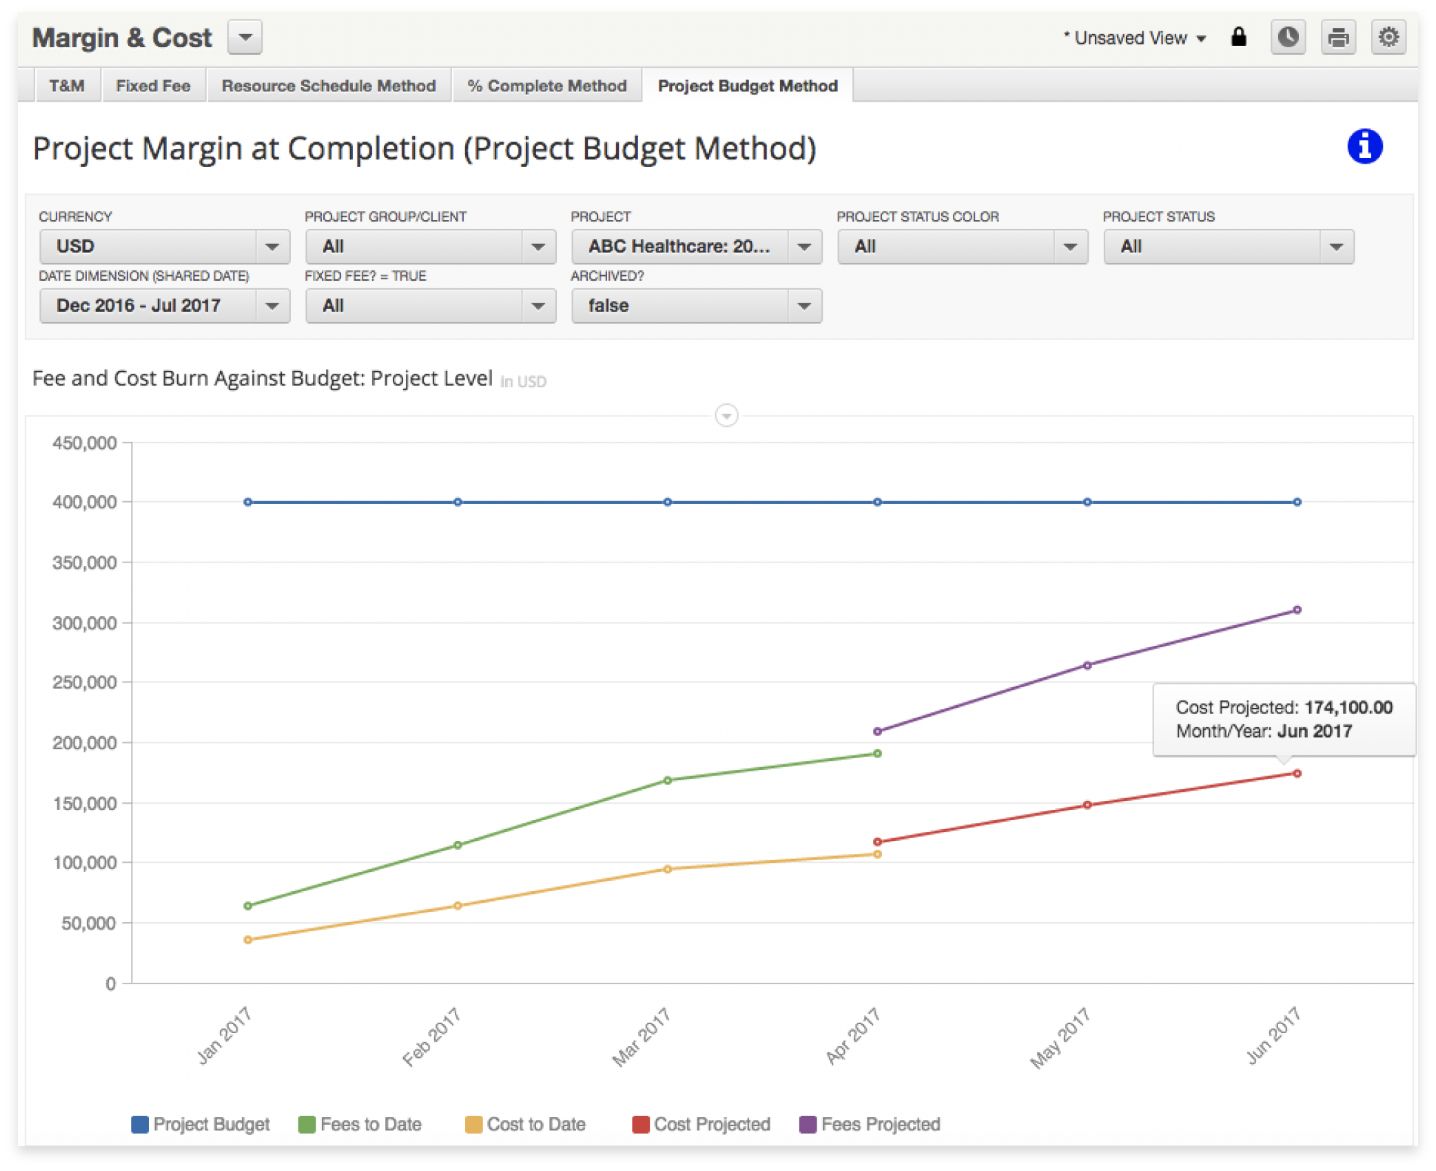
KPI #1

Project Margin

It’s insufficient to only know the profitability of your department, practice area, or office. The best-run services companies manage every project as a distinct Profit and Loss statement (P&L). P&Ls provide details about a project’s revenues, costs, and expenses, revealing the ability of each project to generate profit for the company. When you have this level of insight into every single project, you can predict outcomes that will positively impact your business. For example, you can see which projects regularly meet or exceed margin targets, as well as which ones are routinely unprofitable.
One truth in client services is that your project scope will change during execution. It’s relatively easy to plan to deliver great margins; it’s much more difficult to manage this inevitable change in a way that allows you to remain profitable, as you had planned, at completion.

To understand project margins, you will need to track the current cost of the project and then add in any scheduled cost in the future to get a predictive Estimate at Complete (EAC) margin percentage.

With this information you can view the P&L of a specific project, then view projects by any dimension to discover trends.

Decisions to be Made:

This metric is critical to help you stay on top of project margins while there’s still time to make adjustments to hit your margin targets. With insights into project margin at completion, you will be able to determine if moving resources around or modifying project scope would allow you to increase margins at completion.

Information Required:

Fixed Fee Revenue + Time & Materials Revenue: The financials set aside for project delivery.

Non-Billable Expense: When a resource is doing work that cannot be billed to a client (i.e. administrative duties).

Resource Cost Rate x Hours Logged: Cost of given resource multiplied by hours worked.

Example

Let’s take a look at how a business could monitor their project margin more effectively in a purpose-built solution like the Kantata Professional Services Cloud. Looking at this Project Margins at Completion report, it appears that, for this fixed fee project, according to cost accumulated to date and projected costs for scheduled resources going forward, the project will end up with $174,100 of cost versus the $400,000 budget we will be invoicing the client. The result is a projected Estimate-at-Completion Margin of 56.5%.
IN THE NEXT SECTION
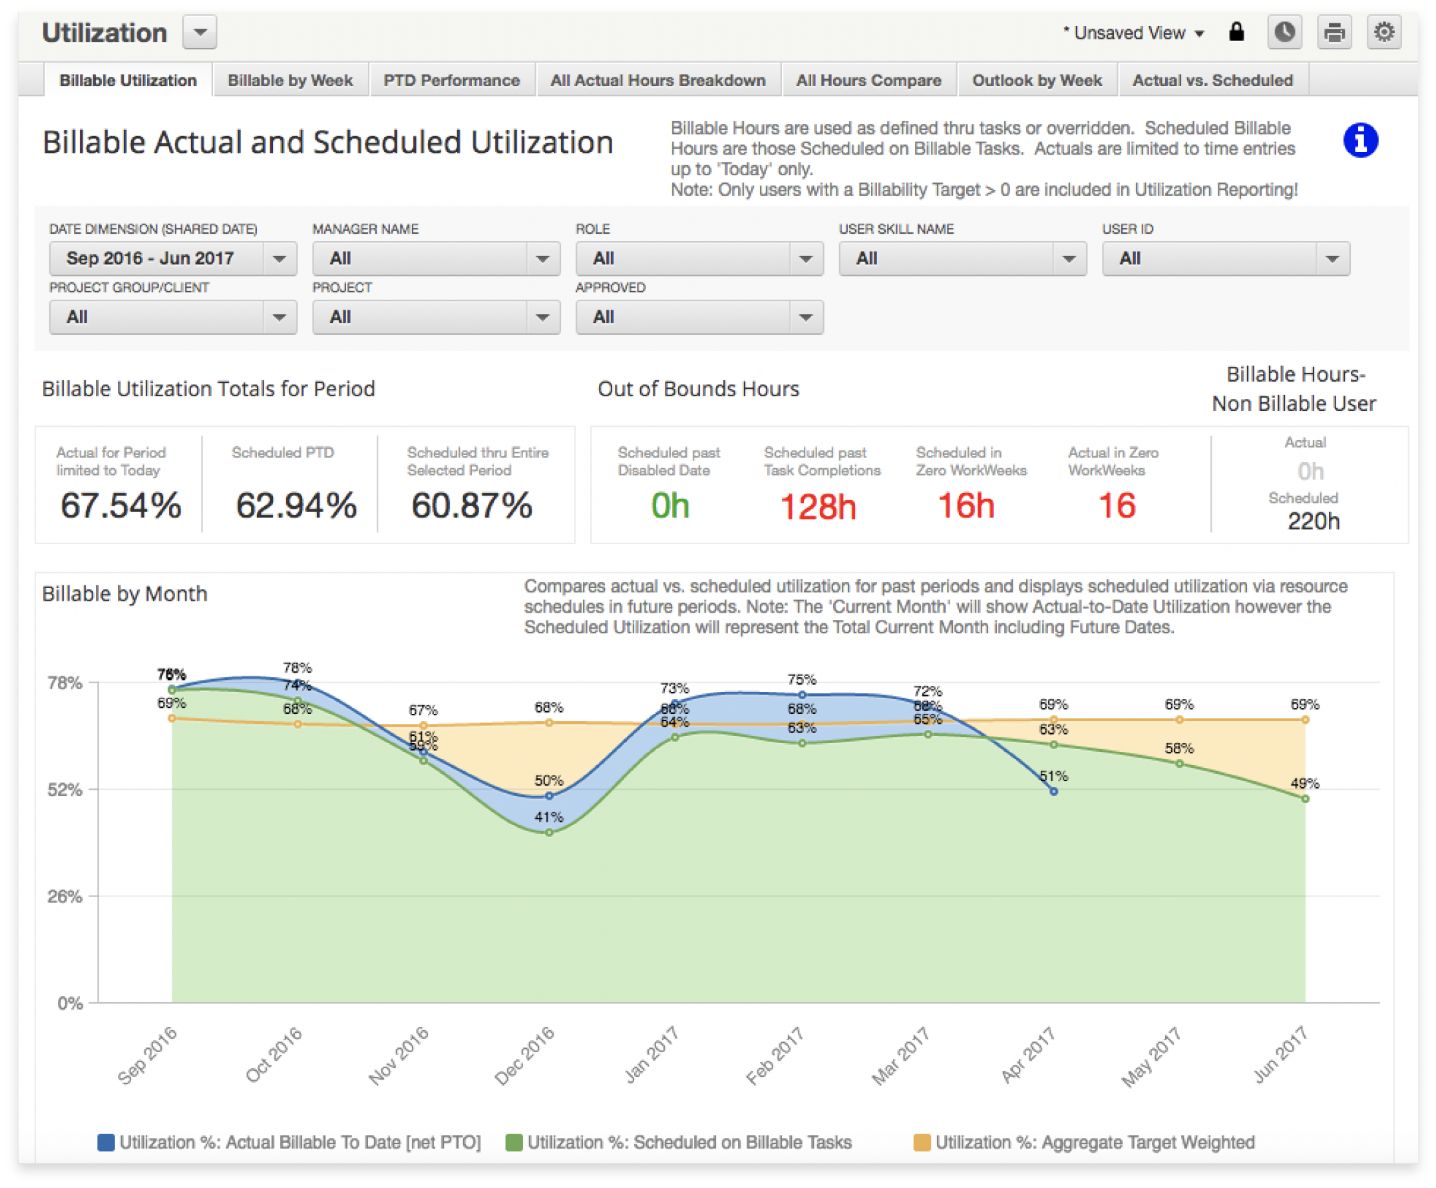
Let’s discuss how to track resource utilization (both planned and actual) against targets.
KPI #2
Planned and Actual Utilization Percentage
You can mitigate this by managing planned and actual utilization rates. Planned utilization measures the time your resources spend working that can be billed to a client. Actual utilization, then, is a view into how much work a particular resource has scheduled, both in the past and future. What’s important about this specific report is that it highlights the relationship between an individual’s actual and scheduled hours compared to predefined organizational and personal targets that are necessary to achieve in order to meet or exceed overall company profitability goals.

For this metric, it is important for you to know where your business lands month-over-month. Are resources hitting scheduled targets? If not, you can dig into what happened. You can also use this data in aggregate to see where improvements need to be made. For example, you are running at 62% utilization, but the target is at 65%, so you are 3% under. These insights are typically leveraged to assess the utilization rate of a specific person, month, or practice area, and you should have various filters so you can drill down where needed.

Decisions to be Made:

If there is no variance between actuals and scheduled, you are properly scheduling resources across projects and each person is at maximum utilization. When you discover a variance, you should move resources around to maximize time spent on billable work. If you are consistently seeing actuals exceed scheduled hours, it means you are not properly scoping projects. Furthermore, viewing utilization performance on a month-over-month basis should be used to make hiring, staffing, and overall personnel usage decisions.

Information Required:

Billable Actual Hours: Billable hours logged up to the day of reporting.

Scheduled Billable Hours: Hours that a resource has been scheduled in the past, present, and future.

Utilization Targets: User-specific goals set by the organization for maximum financial gain.

Resource Work Weeks: Actual billable potential for a resource based on their work week. (ie: 10 versus 50 hours).

Example

Here, we can see an example of Actual Billable Utilization vs Scheduled Billable Utilization being calculated in a report. This shows that following a fall-off in billable utilization during the holidays, the company has exceeded its targets for January through March, though actual billable time is also exceeding what was scheduled. Going forward, it appears scheduled utilization in May and June is under target, or project managers and resource managers have yet to update their project resource schedules. This indicates that recently sold work may not be scheduled out to its fullest extent and more work is needed to stay on target.
IN THE NEXT SECTION
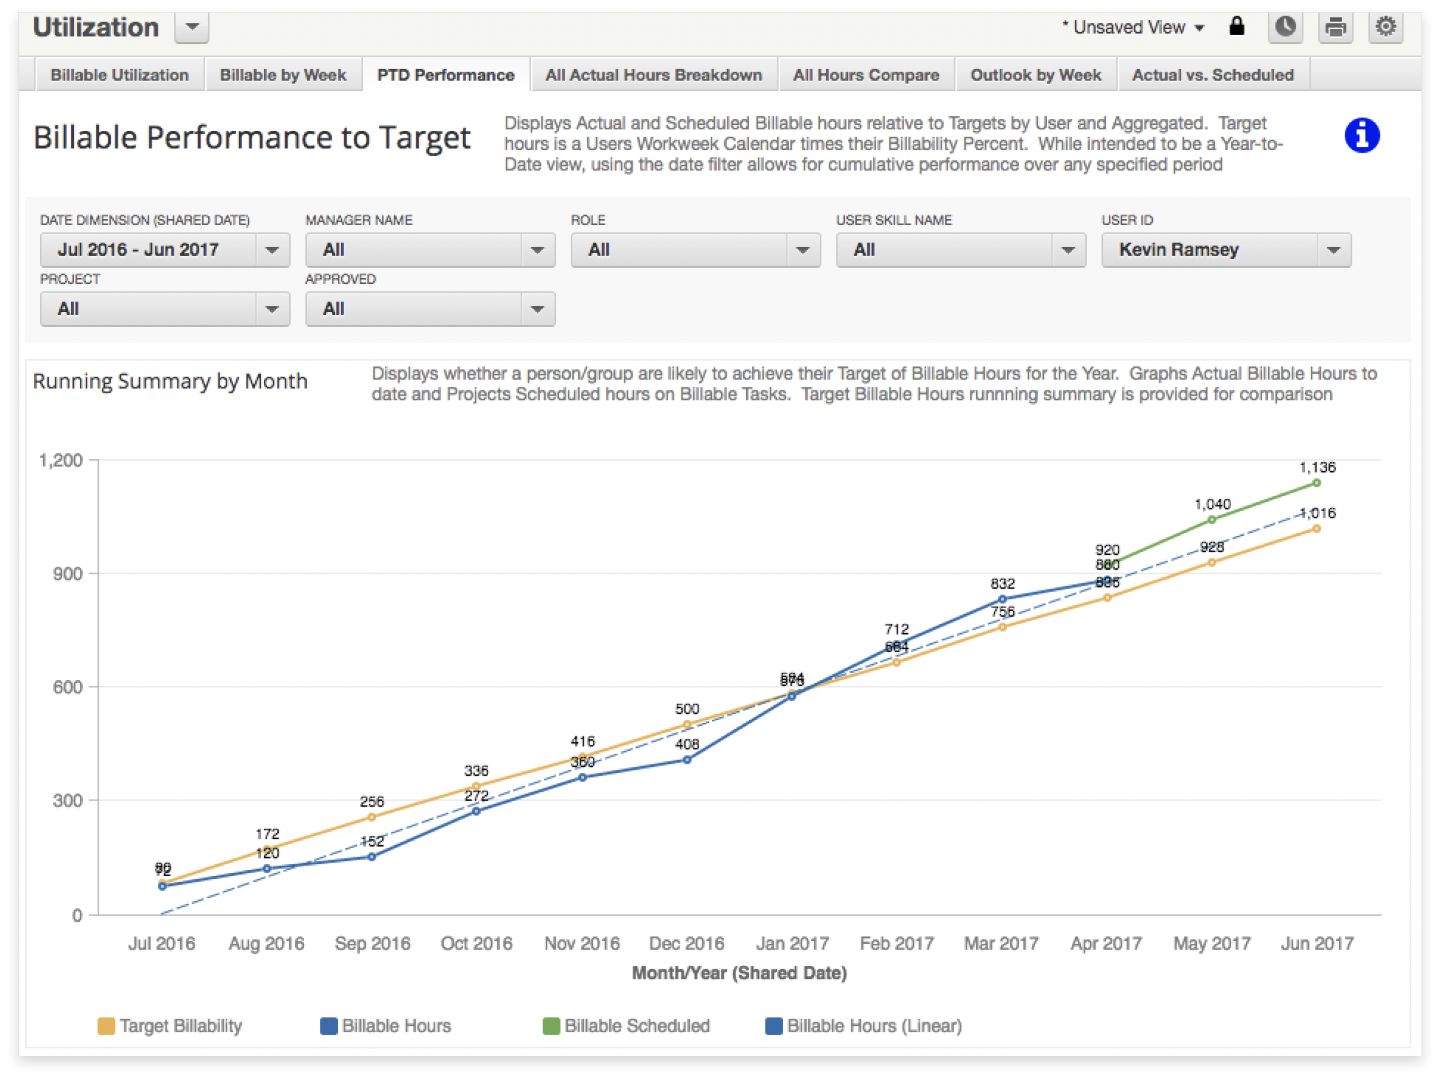
We will introduce a KPI that provides a more cumulative view of billable hours and how the team is tracking against targets on an annual basis.
KPI #3

Billable Performance to Target

While utilization percentages are a critical management KPI, when it comes to the performance of a group or employee, the top performing companies monitor individuals’ billable performance to target. Typically assessed on an annual or semi-annual basis, it’s important to watch trends from actual time spent on revenue-producing projects, combined with the cumulative projection of future scheduled time on the same. As a result, you can see whether the person or group is likely to achieve their end-of-period goals.
To see if your resources are on pace to achieve their target billable hours for a given time period, you need metrics that display actual and scheduled billable hours relative to target billable hours. As opposed to the billable utilization KPI mentioned previously, this is focused on the raw hours rather than percentages. With this report, you also have a view into the future to see if resources are on track to hit their targets or if they are falling behind, and can make key decisions to correct issues.

Decisions to be Made:

If the reporting indicates that an individual is not on track to hit targets, the types of questions to ask include:
  1. Are they accurately tracking their time (impacting their projected time)?
  2. Does this person have demand for their work?
  3. Are they working on enough revenue-generating work versus promotional projects?
  4. Is there need for counseling on work performance?

Information Required:

Billable Actual Hours: Billable hours logged up to the day of reporting.

Scheduled Billable Hours: Hours that a resource has been scheduled in the past, present, and future.

Target Hours: The percentage of time that a resource is expected to be billable.

Resource Work Weeks: Actual billable potential for a resource based on their work week. (ie: 10 versus 50 hours).

This report is focused on the raw hours rather than percentages.

Example

Here’s an example of a report looking at Billable Performance to Target. This data helps us assess a specific resource’s potential to meet their annual billable hours target. It appears this resource’s Actual Billable Performance started slowly and was under target. That has picked up in recent months, and combined with scheduled projects over the next 2 months, it appears this resource will exceed their annual target of 1,016 billable hours by 120 at the end of the fiscal year.
IN THE NEXT SECTION
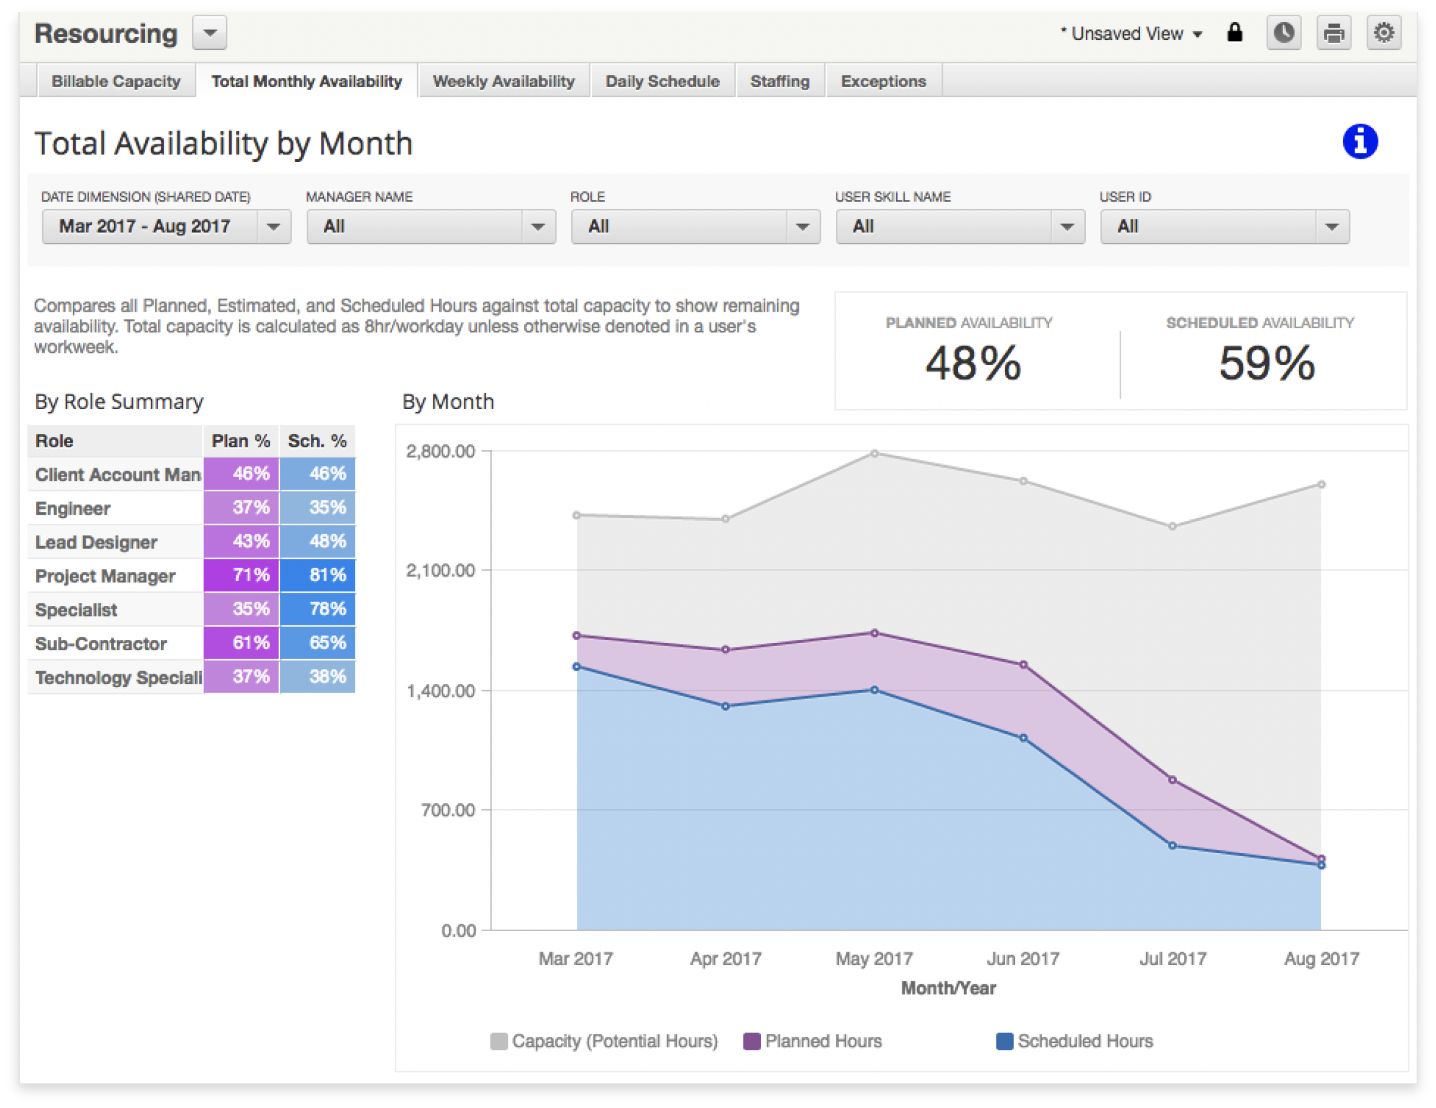
We will explain how to manage the constant struggle between projects and resource availability in the services industry.
KPI #4
Monthly Availability —Optimizing Resource Capacity Planning
To understand remaining availability, calculate billable planned, estimated, and scheduled hours against total capacity. It is imperative to have visibility into both planned and scheduled availability to have an accurate forecast of who is actually free to take on work. In this case, scheduled time is assumed as hard allocated (locked in and unlikely to change), and planned time is assumed as soft allocated (original plan and possible to change). Availability of resources is a fluid and imprecise metric, so through the analysis of both hard allocated resources and soft allocated resources, you can see the potential availability versus the truly unavailable people.

Decisions to be Made:

This information will help you understand if you have enough resources to take on new work. If a certain role, skill, or resource is constantly not available, consider hiring new individuals. If a certain role, skill, or resource is consistently available, make swift moves to assign them to billable work, or restructure the team.

Information Required:

Total Monthly Availability: Available hours for a given resource over a month’s period.

Planned Availability: When a resource is unofficially put on a task, project, or client, the details are likely to change, and the resource will likely be shifted until the project scope is finalized.

Scheduled Availability: When a resource is officially put on a task, project, or client, the details are set in stone and the project is ready to be started. These resources are officially unavailable for any other work.

Example

Looking to see how a business can see their resource availability during a set period of time? In this example of a Total Availability by Month report, we can see that during the period of March through August, the organization has an aggregate availability (or capacity left to use) of between 48% and 59%, depending how many of the planned resource hours needed are converted into scheduled hours. Specifically, if we are looking for Engineers, the availability is around 36%, and we will want to drill into the details to see who is available.
IN THE NEXT SECTION
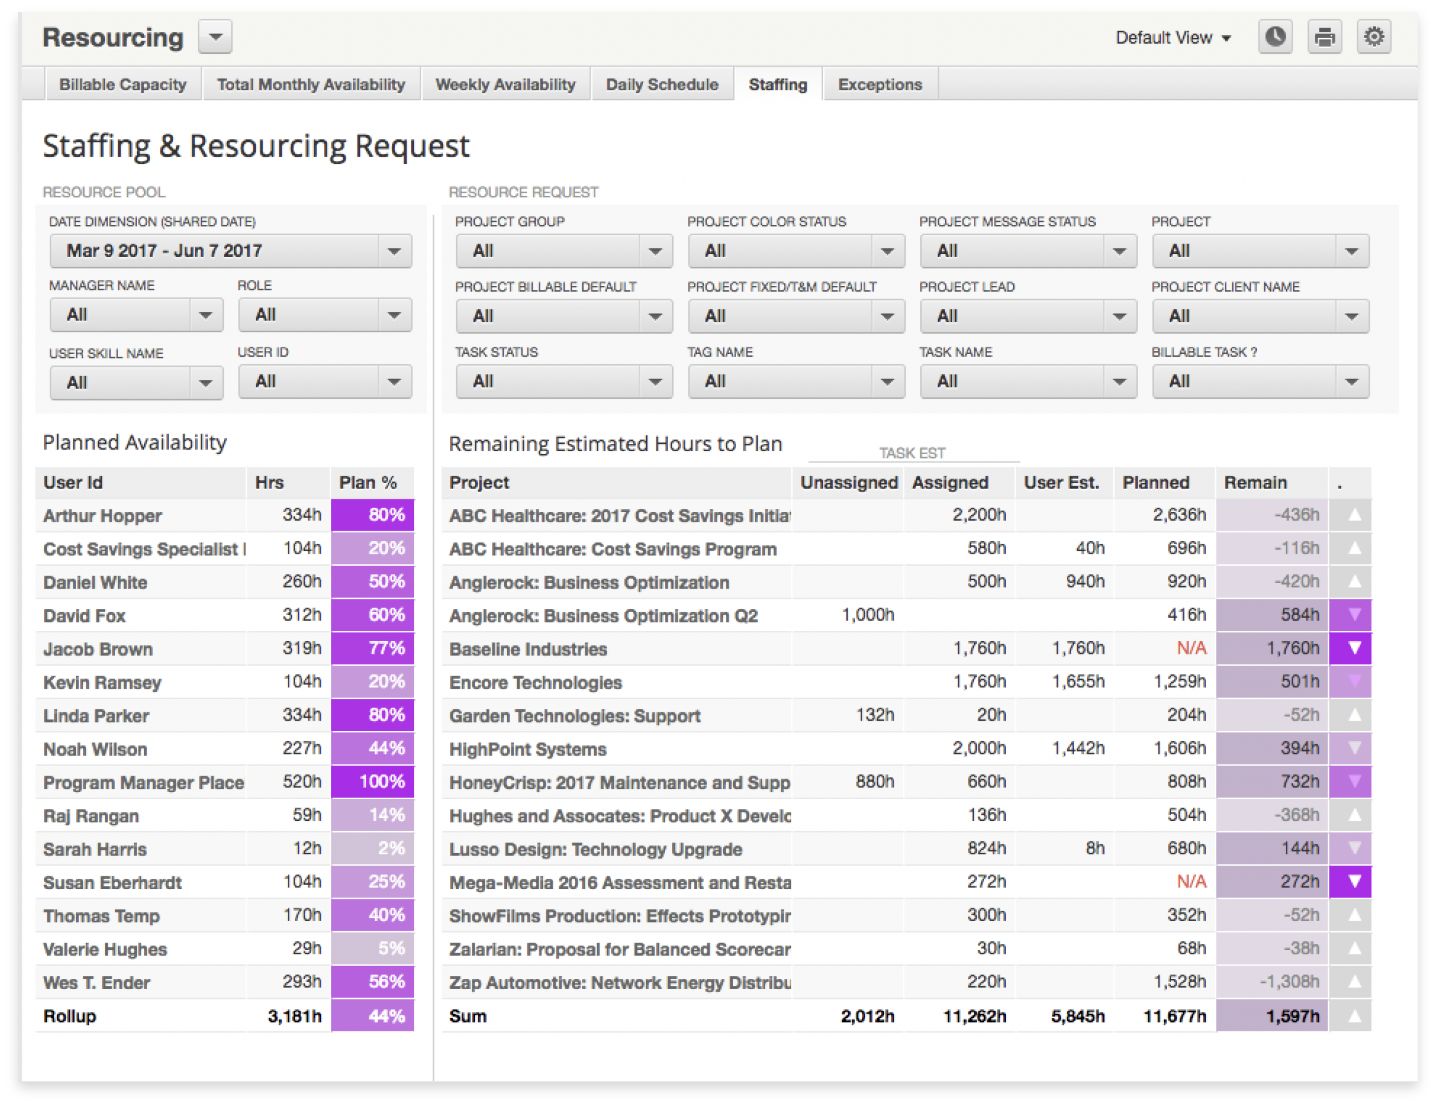
We will introduce the concept of supply and demand, and how reporting can enable you to have the right resources ready for the right projects, at any time.
KPI #5

Supply vs. Demand

One of the greatest sources of profit loss at services companies is failing to recognize when resources are available to work. If the hours on a project are left unassigned, you will lose money until you fill staffing gaps. Your business needs a dashboard that helps you understand what capacity is needed to complete a project, and which resources have the availability and skills to finish it.
This supply and demand metric should display planned and scheduled availability versus remaining hours needed per project. With this view, you will get a breakdown of available resources and new or active projects, as well as the project’s estimated versus planned and scheduled hours to date. This metric is intended to be used by resource managers and other decision-makers responsible for staffing projects, and shows which projects still require billable hours for completion so resources can be proactively moved around to meet shifting demand. This is critical for forward-thinking companies as it allows teams to plan ahead for resource demand and properly forecast required resource needs.

Decisions to be Made:

This metric is all about efficient staffing to improve utilization and successful project delivery. With this information you can determine what is needed to finish a project, and who you can use to finish it.

Information Required:

Planned Hours: When a resource is officially assigned to a task, also referred to as hard allocation.

Scheduled Hours: When a resource is placed on a task but can still be moved around. Also referred to as soft allocation.

Task Estimated Hours: The estimated hours required to complete the given task with given resources.

Example

What does it take to have a companywide understanding of both resource availability and remaining needed hours for projects? Here we can see a report calculating Total Availability. On the right, there are several projects with remaining estimated hours that have either yet to be assigned a resource, or remain ‘under-assigned’ considering the resources that will be needed to get the estimated work done. We can now look to the planned availability on the left to see who might have capacity to fulfill those needs.
IN THE NEXT SECTION
We will discuss the value of metrics, and how to leverage them to move your business forward.
CONCLUSION

Turn Data into Decisions

As the evolving market dynamics continue to drive more demand for the services sector, it has become imperative for organizations to invest in a robust BI tool. Real-time reporting allows you to keep a finger on the pulse of your business through proactive monitoring of KPIs, enabling services firms to make swifter, more informed decisions when reaching for goals. No longer are you stuck with the news of a failed project after it has been closed. Instead, allow your reporting tool to feed you the data necessary to react to project or resource changes as they arise. This way, you are making shifts to impact profitability in real time. With proper business intelligence, no longer do services teams meet goals - they consistently exceed them.

Allow your reporting tool to feed you the data necessary to react to project or resource changes as they arise.

Final Tips to Get the Most Value From Your KPI Metrics:

Make sure your data and BI are as close to real-time as possible. If you need to wait until the end of month billing cycle to review key metrics, it is too late. You need access to the information at a point when you can make swift decisions.

Make metrics easy to understand at first glance. For example, color coding in graphics allows managers to quickly get a pulse — green indicates everything is on track, whereas red might indicate it is at risk.

Make the data and reports available to any individuals who took part in the project. Individuals should have access to their own utilization reports, for example. Empower them with the information they need to impact their performance.

If you spend all of your time gathering the data, then you aren’t spending enough time analyzing it. You need to have a BI tool that can get you the information you need as opposed to having to manually export information into spreadsheets.

KANTATA INSIGHTS

Enterprise-Grade Business Intelligence

The Kantata Professional Services Cloud delivers enterprise-grade BI that puts comprehensive, real-time project analytics within reach so you can get the information you need to drive the results you want. Designed by a team of professional services experts, with Kantata Insights you can gain control over margins, improve resource utilization, and better forecast revenue and costs.

Benefits of Kantata

Get real results with integrated insights and data accessed all in one place, with customized dashboards for individual needs.

Scale with confidence and gain instant insight into your future business health with accurate, granular revenue, margins, and resource capacity forecasts.

Streamline your operation to optimize outcomes based on real-time contextual insights so that you can make strategic decisions with confidence.

Empower your team and improve performance at every level with actionable data that supports each role and visibility across the board for informed management decisions.

Key Features

More than 60 expert-built services-centric reports automatically answer key questions — and predict future outcomes — impacting profitability, utilization, and project success.

Tailor business intelligence insights to answer your most unique and complex business issues with an interactive ad hoc reporting engine.

Forecast demand, availability, and more to prepare your business and steer your teams into a more successful future.

“The real game changer of Kantata is the windshield view of our plans — Kantata gives us an accurate, up-to-date, living and breathing plan.”

KEVIN OCHS
Professional Services Business Management Director at Esri

Get the clarity, control and confidence only Kantata delivers